The current crisis in Ireland’s Accident and Emergency (A&E) department’s is indicative of the strain which is being placed on the State’s health infrastructure. Years of economic austerity, resulting in the curtailment and reduction of capital investment in the construction of new and the maintenance of existing healthcare facilities has created a situation where demand is outstripping capacity. The seasonal growth of flu cases and the intersection of this trend with demand on A&E services arising from the per capita need of these facilities illustrates this point.
One of the solutions frequently advanced to the alleviation of this seasonal issue revolves around the use of nursing home beds as a pressure release for A&E departments. This solution ignores the demand which currently exists on capacity in these facilities and furthermore, it displaces older people who require treatment within these facilities, potentially impairing longer term health outcomes.
There are 608 nursing homes in Ireland. {:class=“center”}
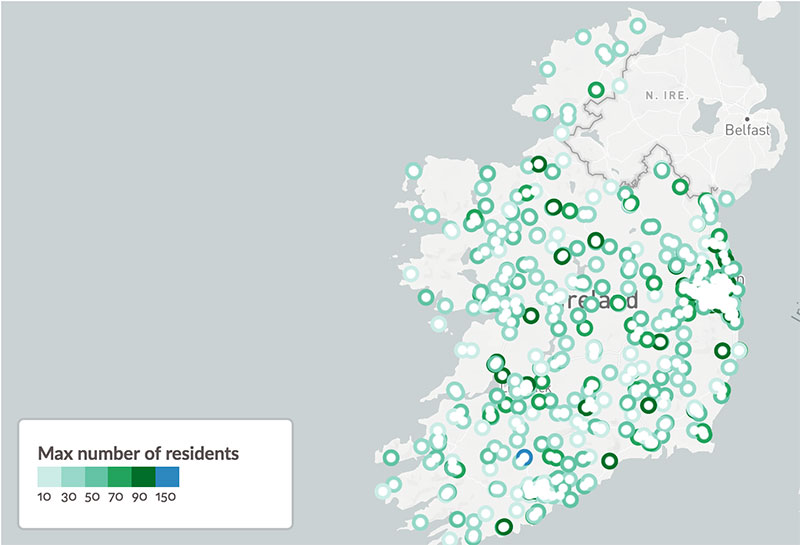
As of January 2017, PHR estimates that there are 30,600 beds within public and private sector nursing homes operating within the State. This supply will be insufficient in terms of serving an older population as the demographic age categories associated with this form of care will expand significantly over the coming decades. Once Census 2016 returns become available, accurate projections around the expansion of these age categories. A myriad of factors constrains the supply of new stock, such as competition for residentially zoned lands proximate to transport networks.
Table 1 Ireland’s Nursing Home Sector at a Glance {:class=“center”}
| County | Total Number of Bedspaces | Number of Nursing Homes per County |
|---|---|---|
| Carlow | 417 | 9 |
| Cavan | 524 | 11 |
| Clare | 892 | 16 |
| Cork | 3573 | 71 |
| Donegal | 920 | 23 |
| Dublin | 7375 | 112 |
| Galway | 1876 | 43 |
| Kerry | 1052 | 24 |
| Kildare | 1625 | 23 |
| Kilkenny | 711 | 17 |
| Laois | 271 | 6 |
| Leitrim | 277 | 6 |
| Limerick | 1296 | 26 |
| Longford | 284 | 4 |
| Louth | 603 | 13 |
| Mayo | 997 | 23 |
| Meath | 1070 | 20 |
| Monaghan | 383 | 7 |
| Offaly | 551 | 11 |
| Roscommon | 699 | 14 |
| Sligo | 448 | 8 |
| Tipperary | 1291 | 33 |
| Waterford | 768 | 13 |
| Westmeath | 672 | 15 |
| Wexford | 940 | 17 |
| Wicklow | 994 | 21 |
| {:class=“table”} |
The stock in the ownership of the HSE (Health Service Executive) is set out below in table 2. These facilities are amongst the most challenging in terms of their capacity to be maintained going forward. Many of the HSE’s facilities are in legacy buildings with increased maintenance needs owing to their historic nature. The majority of HSE run facilities are struggling to attain the requisite standards as set out by the Health Information Quality Authority (HIQA).
Table 2 - HSE Facilities {:class=“center”}
| County | Total Number of Beds | Number of HomesTotal Number of Beds |
|---|---|---|
| Carlow | 77 | 2 |
| Cavan | 127 | 4 |
| Clare | 202 | 4 |
| Cork | 1028 | 21 |
| Donegal | 384 | 11 |
| Dublin | 943 | 16 |
| Galway | 280 | 7 |
| Kerry | 293 | 6 |
| Kildare | 158 | 2 |
| Kilkenny | 108 | 2 |
| Laois | 125 | 3 |
| Leitrim | 167 | 4 |
| Limerick | 160 | 2 |
| Longford | 68 | 1 |
| Louth | 170 | 5 |
| Mayo | 238 | 6 |
| Meath | 94 | 2 |
| Monaghan | 91 | 2 |
| Offaly | 140 | 3 |
| Roscommon | 164 | 3 |
| Sligo | 100 | 1 |
| Tipperary | 327 | 7 |
| Waterford | 235 | 3 |
| Westmeath | 88 | 3 |
| Wexford | 217 | 4 |
| Wicklow | 152 | 2 |
| {:class=“table”} |
In terms of the planning pipeline for this form of development, a review of planning applications lodged in 2016 is illustrative in terms of the nature of works being proposed to develop new or modernise and extend existing facilities around the State. In 2016, 46 applications relating to nursing home development were lodged for consideration to local authorities around the State.
The nature of these applications is set out below.
- New Nursing Home Development
- Modification/Extension of an Existing Nursing Home
- Change of Use from a nursing home to another form of development
- Change of Use from another form of development to a nursing home
In terms of the status of these planning permissions are set out below. The majority of applications were located in the East and South-East. All planning appeals decided in 2016 related to applications made in 2015.
| decision | No. of Beds | No. of Applications |
|---|---|---|
| Further Information Requested | 161 | 1 |
| Granted (Local Authority) | 259 | 16 |
| Undecided / Ongoing | 618 | 26 |
| Refused (Local Authority) | 60 | 1 |
| {:class=“table”} |
In total, the valid applications which have been decided upon by planning authorities equates to an additional 259 beds nationally.
Spatial distribution of applications
{:class=“center”}
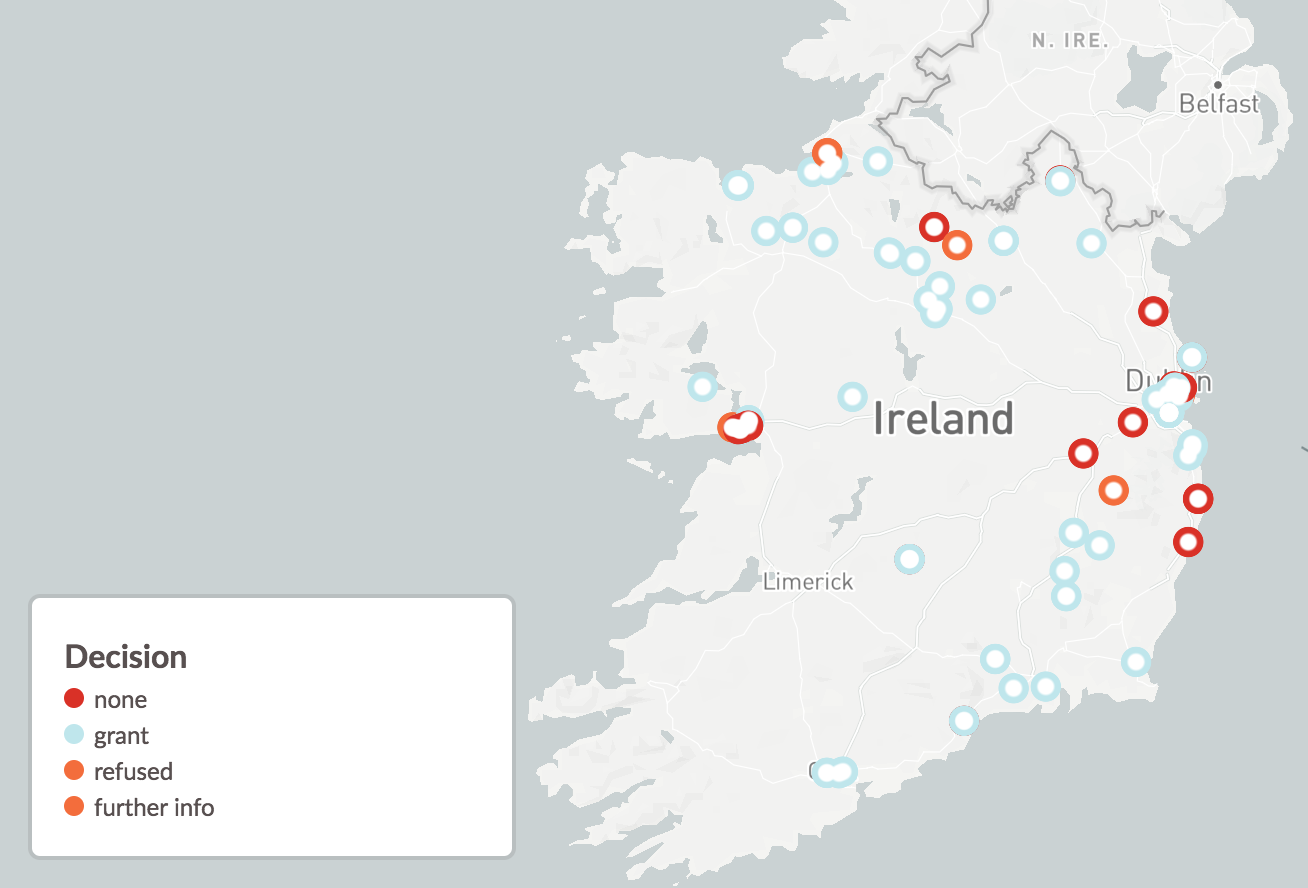 {:id=“app-map”}